Background
jLogo Programming
- Commanding a Turtle
- Pseudocode
- Adding New Commands
- Iteration & Animation
- Hierarchical Structure
- Procedure Inputs
- Operators & Expressions
- Defining Operators
- Words & Sentences
- User Interface Events
- What If? (Predicates)
- Recursion
- Local Variables
- Global Variables
- Word/Sentence Iteration
- Mastermind Project
- Turtles As Actors
- Arrays
- File Input/Output
- AI: Pitcher Problem Solver
Java
- A Java Program
- What's a Class?
- Extending Existing Classes
- Types
- Turtle Graphics
- Control Flow
- User Interface Events
Appendices
- Jargon
- What Is TG?
- TG Directives
- jLogo Primitives
- TG Editor
- Java Tables
- Example Programs
- *** New ***:
Installation Notes
Updates
- December 13, 2008
- March 7, 2009
- January 6, 2012
- March 15, 2013
- January 20, 2014
- February 13, 2014
- July 29, 2014
- January 18, 2016
- January 29, 2016
- August 19, 2016
Lastly
Operators & Expressions
Introduction
So... what have we not yet seen in this introduction to computer programming?
The answer... we have not computed anything. We have gotten the turtle to do some drawing and some acting (animation). Techniques for reducing the complexity in our programs, so that they do what we want, have been at the heart of a few lessons. Now it is time to cover procedures that compute.
In this lesson, you will learn about a new kind of procedure called an operator. Operators produce an output. You'll work with some of the most commonly-used operators, Logo's built-in math stuff.
Most operators take inputs; they do something with the inputs to produce the output, e.g., the sum operator adds its inputs and the result is the procedure's output.
Operators can be combined to form expressions. Since jLogo only provides a prefix operator notation, constructing expressions can be a bit confusing at first. Plumbing Diagrams let you visualize the expressions, so you will learn how to draw them.
Operators
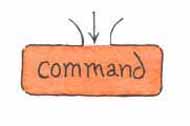
So far, all of the procedures you have been working with have been commands. What commands do is produce an effect. The commands you have been using do things that you can see when you invoke them, e.g., the turtle draws a line, the turtle rotates, the color of the turtle's pen is changed, etc... There is another kind of procedure called an operator.
An operator is a procedure that produces an output. The output is used somewhere you need an input.
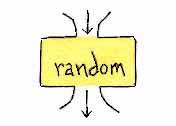
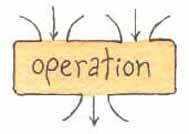
To help you learn and understand operator expressions I'm going to use what Brian Harvey calls plumbing diagrams in his book Computer Science, Logo Style . Plumbing diagrams consist of boxes representing procedures. If a procedure is defined to have inputs, there are openings in the top of the box, one for each input. If the procedure produces an output, there is an opening out the bottom of the box. Figure 8.1 shows boxes for a command with an input, and an operator with one input and an output.
 |
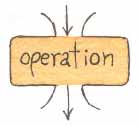 |
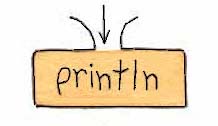
Figure 8.2 shows the plumbing diagram boxes for a command and an operator, both of which you've not yet seen. println displays its input in TG's CommandCenter and then moves the cursor to the first column of the next line. random expects an input which should be a positive integer and produces an output, an integer which is greater than or equal to zero and is less than the input.
 |
 |
As an example, invoking random with an input of 5 will cause it to output one of the integers: 0, 1, 2, 3, or 4. You can see this by combining println (which takes an input) with random. Here are 3 examples of using println, one of which includes using random. pr is the abbreviated form of println.
|
Use the following TG applet to try stuff out for yourself.
TG Programming Environment Applet
Beware! If you use an operator, its output needs somewhere to go. Try leaving out the println command, e.g.,
|
You'll get an error message pop-up:

|
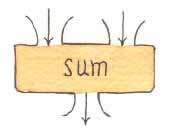
Operators can have more than one input but can only produce one output. As an example, the sum operator takes two inputs and outputs the value of the sum of the two inputs. Figure 8.3 shows the plumbing diagram boxes for a generic operator with two inputs and the sum operator.
 |
 |
There are a few operators which do not have an input, they simply produce an output. These operators simply provide information. Two such operators can be used to get the current size of TG's graphics canvas. As its name suggests, the canvasheight operator outputs the number of turtle steps (pixels) it would currently take to get from the bottom of the canvas to the top. Its complement, canvaswidth outputs how wide the canvas currently is.
Table 8.1 contains the most common math operators, as well as a couple of other procedures we'll use in this lesson. Try out each of them; play around a bit in the TG applet above.
NOTE: you will have to use TG's menu system to open the graphics canvas in the applet before canvasheight or canvaswidth will work.
| Operator | Inputs | Description |
| CANVASHEIGHT | Outputs the height of the graphics canvas in turtle steps (pixels) | |
| CANVASWIDTH | Outputs the width of the graphics canvas in turtle steps (pixels) | |
| DIFFERENCE | number1 number2 | Outputs the result of subtracting number2 from number1 |
| MINUS | number | Outputs the negative of number |
| POWER | number1 number2 | Outputs number1 to the number2 power |
| PRODUCT | number1 number2 | Outputs the result of multiplying number1 by number2 |
| QUOTIENT | number1 number2 | Outputs the result of dividing number1 by number2 |
| RANDOM | number | Outputs an integer greater-than or equal-to zero AND less-than number |
| SQRT | number | Outputs the square root of number |
| SUM | number1 number2 | Outputs the result of adding number1 and number2 |
| |
||
One thing that may appear strange at first is the way the name of the operation comes first, followed by its inputs. But, if you think about it, jLogo is consistant - all of its procedures are entered this way. First you have something that you want done, then comes the thing or things it will use as input(s). With a little experience (practice), you will get used to this way of doing things.
Here is a procedure that computes the area of a rectangle and prints it.
|
In computer science, when an operator precedes its inputs (its operands) it is called prefix operator notation. Most programming languages support what's called infix notation, e.g., "3 + 2" and "12 / 3." As you can see, the operator is placed between the operands. Logo interpreters support both prefix and infix notations for math and relational operators. But in these lessons you will only work with prefix operators (see here for my reasoning).
Expressions - Operator Combinations
Expressions are compositions of operations that produce an output. In expressions, the output of one operation is fed into another operation as an input. Until you get some practice putting together expressions, they can be a bit confusing. But, don't get frustrated, this is where plumbing diagrams save the day! Plumbing diagrams can help you understand the structure of the expression. The organization that they show graphically makes jLogo expressions much easier to write.
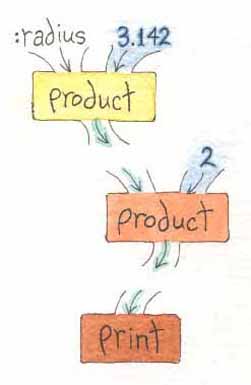
Take, for example, computing the circumference and area of a circle, given its radius.
|
Here are their corresponding plumbing diagrams.
 |
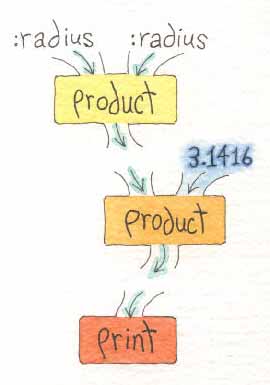 |
Notice one new thing I've introduced in the code above, parenthesis. I added them to make the code easier to read. jLogo will check to ensure that matching parenthesis surround complete expressions. So, use them as you see fit.
Practice: Expressions And Plumbing Diagrams
Following are some very common math applications you work with in high school math classes.
-
Draw a plumbing diagram for a tip calculator which takes two
numbers as inputs: the bill's total cost and the percentage of the
tip. The output of the expression (the amount of the tip) should
be input to a println command box.
Then write the procedure tipCalc which prints the tip amount. Here are some sample computations and some inputs without the tip percent left for you to check your program with.Bill Total Tip % Tip $ $10 15 1.50 $15 20 3.00 $32 16 ? $22 18 ? $47 17 ? -
The average of a bunch of numbers is the sum of the numbers divided by
the number of numbers.
Draw a plumbing diagram for the expression which averages four numbers.
Write procedures to print the average of the numbers:
(a)  66, 10, 47
(b)  22, 87, 15, 41
(c)  83, 31, 72, 19, 6
-
Given Pythagoras'
Theorem ( the length of the hypotenuse of a right triangle is equal
to the square root of the sum of the squares of each of its legs' lengths),
Draw a plumbing diagram for this expression.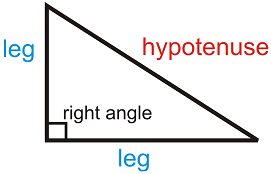
Then write a procedure which prints the length of the hypotenuse of a right triangle, given the lengths of its legs. -
Write procedures which print the surface area and the volume of
a sphere, given its radius. Here are the formulas you need.
Fill in the empty cells with the values your procedures print rounded to thousandths.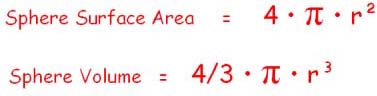
Unit
AmountSurface Area
(Unit2)Volume
(Unit3)1 12.566 4.189 2 ? ? 3 ? ? 4 ? ?
After you've completed your programs, check your answers here.
An Improved fillRect Procedure
In the previous lesson, we wrote a procedure named fillRect which drew solid-colored rectangles. Our implementation had the turtle, with a pen size of 1, traveling over and coloring, every pixel in the rectangle. If we invoked fillRect with a width input of 100 and a height input of 50, the turtle would walk forward and then backward 50 steps for each column of pixels in the rectangle. The turtle would travel 1099 turtle steps in order to paint the 100x50 rectangle (the 99 is for moving from one column to the next column). Luckily for us, our digital turtle is tireless and doesn't mind. But now that we have math operations, we can make the turtle's job easier.
In the iteration lesson when we drew a circle, one approach was to draw its perimeter as a bunch of BIG points, each a solid-colored box. All we did was to use a very thick pen, and draw a line of equal length to the pen's width. We should be able to do the same sort of thing to draw any solid-colored box.
By computing the middle point of the height of the desired rectangle, we can move the turtle to this Y coordinate along with the left X coordinate. Then by setting the pen size to the height, heading the turtle east, and lowering the pen, we can get it to draw, moving forward the width of the rectangle. In our example of a 100x50 rectangle, the turtle only moves 100 steps in order to paint it. Now that's a big improvement.
Here's the source code for our new fillRect. Read it; type it in and watch it be performed by throttling the turtle.
|
Project: Lots of Boxes
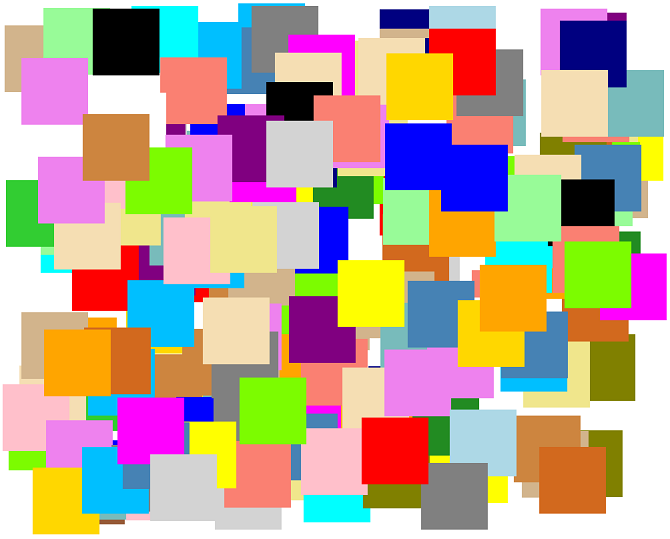
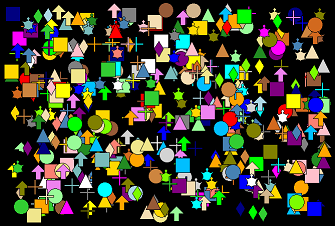
Time for a project. We are going to create a few digital collages. Figure 8.5 shows a couple of examples. Click on either image to see a larger copy of it.
|
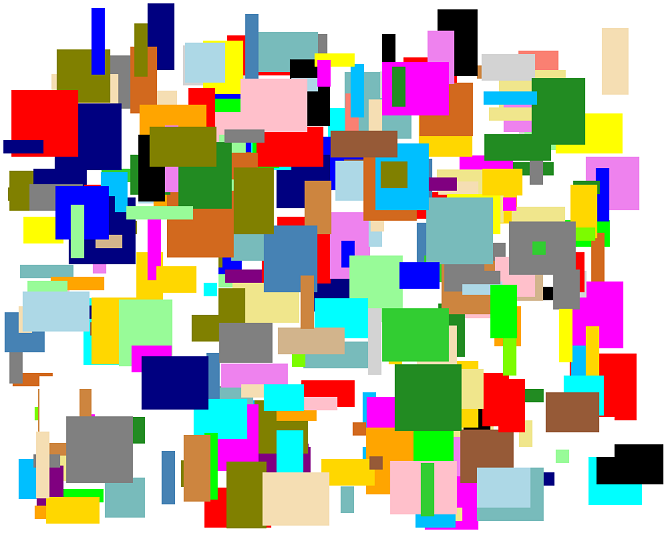
|
The first image consists of hundreds of colored boxes. The boxes are all the same size, but their locations and colors have been chosen randomly. The second image is similar, but the sizes of the boxes vary from twenty turtle steps on a side to one hundred turtle steps on a side, in twenty step increments. The sizes were chosen randomly.
Relying on our steps for writing computer programs, we'll start writing our new program RandomBoxes with:
1. Understanding the Problem
And to help with this, I've written down everything you should know about the problem.
- We can use fillRect to paint the boxes on the graphics canvas.
-
The turtle's pen can be set to at least thirty-two different colors. The
setpencolor procedure expects an input that's
zero for black, one for blue, etc... up to thirty-one for olive. Type "help
setpencolor" in the CommandCenter or
click here for more information about setpencolor,
to get the full list.
Invoking random with an input of 32 will get it to output an integer in the range of 0 through 31. - The size of TG's graphics canvas can be obtained using the canvasheight and canvaswidth operators. In the last lesson you learned about moving the turtle to TurtleSpace coordinates with, as an example, setxy. The center of TurtleSpace is the coordinates X=0 and Y=0. So, half of the X coordinates will be negative and half will be positive. If canvaswidth outputs 600, then the turtle will remain in the viewable space as long as its X coordinate is greater than or equal to -300 and less than or equal to 300.
This is a good bit of information about the problem we are solving. It's enough for us to get going; let's move on to the next step in writing a computer program...
2. Devising a Plan
The plan is best expressed as pseudo-code. Our RandomBoxes program, which produces the artwork shown on the left in Figure 8.5 (equal-sized boxes), is pretty simple.
  1. repeat the following sub-steps a number of times
  1.1. set the color of the turtle's pen to some random value
  1.2. invoke fillRect with a random X,Y location and width and height values of 100
And given this we will write two procedures:
- drawRandomBox, which sets the pen to a random color then invokes fillRect to draw a box at some random location in TurtleSpace.
- main which does some initialization stuff and then invokes a procedure named drawRandomBox a bunch of times.
What we now have is a layer-cake of three levels of abstraction, a hierarchy that looks like Figure 8.6.
| |
| |
| |
The next step in our process of writing RandomBoxes is...
3. Carrying out the Plan
This means entering the Logo procedures. To get started, we should enter the version of fillRect we just wrote and test it. Next, we'll define the new procedure drawRandomBox.
It's always nice to get something working; so, I'll type in a partially functional version of it. It will draw a black box with its lower-left corner at 0,0.
|
What's nice about this is that we can verify that we have a program that at least partially works. It is always easier to find problems when you incrementally develop your programs. In the code above, the parts of drawRandomBox that I still need to figure out have been documented in comments. Once I have what I know how to do working, I'll fix the source code, one change at a time, with code that accomplishes what the comment says. Try your version of the procedure out. You should be able to invoke drawRandomBox in the CommandCenter and end up with a solid box displayed.
To wrap up our first pass at the program, we add a main that initializes the graphics canvas, and then repeatedly invokes drawRandomBox.
|
Once we get this initial version of our program working, we can fix the stuff we documented in the comment lines - one thing at a time. But now take the time to get what I've shown you working. Don't read on until you've done this...
A Random Pen Color
Time to add some randomness to our program. The first comment that needs to be converted to Logo code is the one that sets the pen's color to some random number. What's our first step? How about drawing a plumbing diagram? I can do that; here it is.
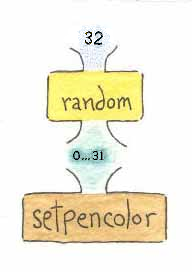 Figure 8.7
In this diagram, we have the literal 32 as an input to the random operator (which produces an output (a number in the range of 0 through 31, inclusive). The output from random is then supplied as an input to the setpencolor command.
Now it's your turn; convert this plumbing diagram into source code and replace the literal 0 input to setpencolor with your code.
Test it by invoking drawRandomBox a few times. If your changes are working, you should now be seeing a box that is a different color each time you invoke drawRandomBox. Remember that it is possible to get the same color two times in a row - the numbers output by the random operator are truely random.
Once you have this working...
Random Box Locations
Now let's move on to the random X input to the fillRect procedure. Again, we start with a plumbing diagram, as shown in Figure 8.8.
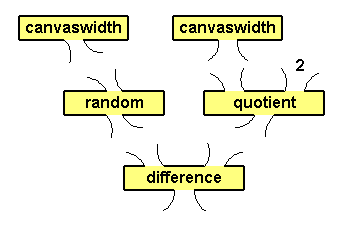 |
As mentioned above, canvaswidth outputs the number of turtle steps from the left edge of the graphics canvas to the right edge. But half of the X coordinates are negative and almost half are positive (the zero X coordinate must be accounted for). So what we need to do is map 1 .. canvaswidth to - (canvaswidth/2) .. (canvaswidth/2)-1. So, as shown in the plumbing diagram, we input canvaswidth to random and then subtract half of canvaswidth from its output.
Let's walk through a few examples presented in Table 8.2. In the first four rows, canvaswidth outputs 640. When this is input to random, its outputs will be in the range of 0 .. 639. The middle column provides outputs from random given the inputs from column one. The third column is the X coordinate that would become an input to the fillRect procedure.
The first two rows of Table 8.2 contain real random outputs; the middle two are edge cases. The edge cases are the minimum and maximum values output by random for the input of 640. The last two rows are left as an exercise for you to verify you understand what is going on.
| output |
output |
output |
| |
|
|
| |
|
|
| |
|
|
| |
|
|
| |
|
|
| |
|
|
| |
||
After you have figured out the outputs, check your answers here.
Ok, now it is your turn. Convert Figure 8.8 into Logo source code and replace the first zero in the invocation of fillRect (in drawRandomBox) with it.
Test your code by invoking drawRandomBox in the CommandCenter a few times. Each time, a box should appear in a random X location, in a random color. But all of the boxes will have their lower edge at Y coordinate 0. You still need to draw a plumbing diagram and then code for computing a random Y coordinate. But it's best to change one part of your program at a time.
Complete the program. Computing a random Y coordinate is very similar to what we've done for the X coordinate.
One problem you might run into is fitting the fillRect invocation on a single line, especially if you are working in the TG applet above. The source code expression for my random X computation takes 58 characters (including spaces and parenthesis to improve readability). Assuming the expression to compute a random Y coordinate will be similar, there is not enough room on a line in the applet to include both expressions.
Tilde (~)
Since all instructions in jLogo must fit on a line, the Editor treats a tilde (~) character specially. If a tilde is the last character on a line, when the Editor's contents are interpreted, the tilde is ignored and the current line is joined with the following line. In programmer language the tilde is acting as a continuation character.
In the previous lesson, we wrote the procedure drawAxis which had a long line in it, a repeat instruction. Here is how we could have entered it into the Editor on two lines.
|
You can, and probably should, break the fillRect invocation in drawRandomBox into multiple lines. Note how I indented the second line to reflect the continuation. A REPEAT command has two inputs. So what I have done is indent the continued line, which is the second input, so that it lines up with the beginning of the first input. Although this is not necessary, it is something I always do to make the code easier to read.
BUG: ?Partial Boxes at Top, Right, and Left?
Ok, so I didn't give you the complete solution to the program... If you've only been following along, not thinking hard about your program, it is going to have a bug in it. Your boxes go off the top and right sides of the graphics canvas. Compare what your program draws with Figure 8.5. If you have partial boxes, fix this...
Practice: Boxes Changes/Extensions
-
The second collage in Figure 8.5 has randomly
sized boxes. The sizes of the boxes vary from twenty turtle steps on a
side to one hundred turtle steps on a side, in twenty step increments.
Figure 8.9 is a plumbing diagram for an expression that will output
these values.
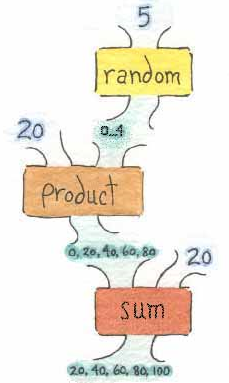 Figure 8.9
-
Make some change, any change you want, to create your own collage.
I played around a bit and here are some examples I came up with.
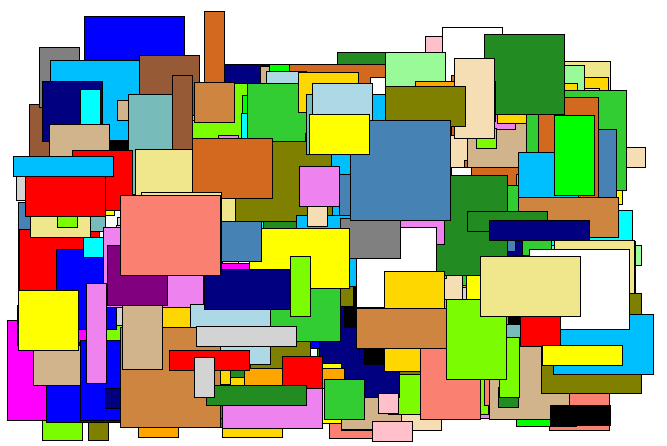
The collage on the left side of figure 8.10 shows a simple change,
I added black edges to the random boxes - painted the perimeters of the
boxes black. Although the change appears simple, the program is a
little tricky. The collage on the right side is random colored,
random turtle shapes which have
been STAMPed at random locations. The
STAMP command has not been covered in these
lessons yet. It simply paints a turtle's current image onto the
canvas underneath it, see: Appendix D
(Primitive Procedures).
Figure 8.10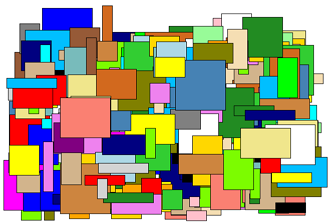

Project: A Street of Different Houses
On to a much more interesting challenge: get the turtle to draw a street of houses with varied height and width.
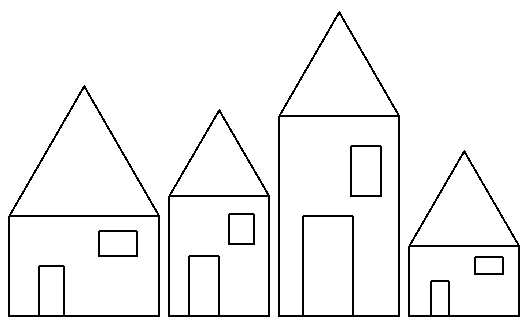 Figure 8.11
Notice how the houses in Figure 8.11 are similar, but a bit different from each other. Look close and you'll notice that the taller the house, the taller the door and the window are. The wider the house is, the wider the door and the window are. All the parts vary in proportion.
Start with the the DrawStreet program you wrote in lesson 6 (Hierarchical Structure). It drew a street of identical houses as shown in Figure 8.12.
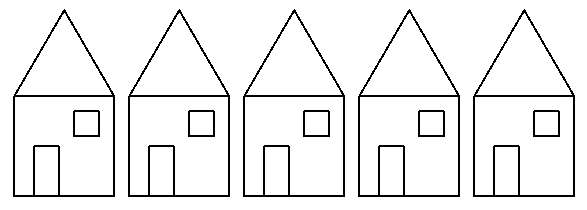 Figure 8.12
You should modify the drawHouse procedure in it. Give it four inputs; here's my new program's drawHouse contract and title line.
|
To get figure 8.11, I replaced the body of my drawStreet procedure, which was basically
|
with
|
But this was what my finished program's drawStreet procedure looked like. I started off with a simpler goal. Experienced programmers plan out how to get to the end result by making a series of small changes. For example, my first step was to only add the :leftX and :bottomY inputs to drawHouse. The body of my drawStreet was:
|
When this worked, it drew a street that looked like figure 8.13.
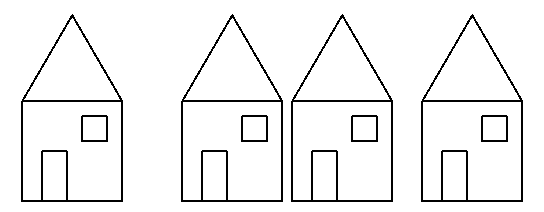 Figure 8.13
Once I had this working, I added the :height and :width inputs to my drawHouse, drawFront, and drawRoof procedures. I modified the body of drawStreet supplying all four inputs to drawHouse, as shown above.. When this worked, it drew a street that looked like figure 8.14.
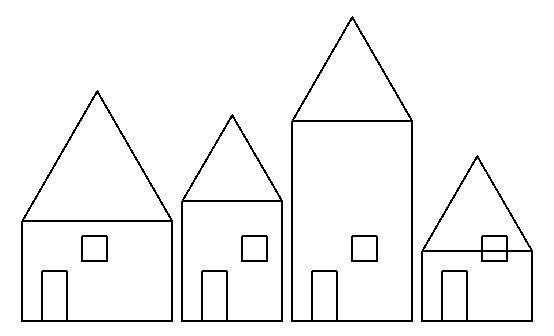 Figure 8.14
Getting close... the door and window still need fixed. It's time to modify drawDoor and drawWindow, give them inputs like the drawFront and drawRoof now have. So, step by step, the procedures for drawing the house are modified until the program draws Figure 8.11.
Summary
You've learned about operators, procedures which produce an output value. This output value is then fed into another procedure's input.
Youve been exposed to many of the operators that are built into Logo, mostly the mathematical operators for basic arithmetic.
You've learned how to construct plumbing diagrams which help you visualize how to connect commands, literals, and operators to form expressions you need in your programs.
Finally, you've used the println command to display literals and the values output from operators and expressions. Putting println commands in your programs allows you to see what they are doing.
Go to the Table of Contents
On to: Defining Operators
